
Influence of Local Tumor Factors and Radiotherapy Dose on Prognosis of Clinical Stage T1-4N0M0 Esophageal Squamous Cell Carcinoma
-
摘要:目的
探讨不同放疗剂量对接受根治性放(化)疗的cT1-4N0M0期食管鳞癌患者不同肿瘤局部因素亚组人群预后的影响。
方法对256例临床无转移食管鳞癌患者进行回顾性分析,明确肿瘤局部因素指标预测患者预后的最佳截断值,分析近期疗效与肿瘤局部因素相关指标的关系,多因素分析影响患者OS的独立性指标,最后进行亚组分析,确定从不同放疗剂量中获益的亚组人群。
结果食管肿瘤病变X线长度越短、食管管壁厚度和GTV越小,患者近期疗效越好(χ2=9.066、10.310、15.661,P=0.011、0.006、<0.001)。多因素分析结果显示,食管GTV(P<0.001)、放疗剂量(P=0.038)和近期疗效(P<0.001)等3项指标为影响患者OS的独立性指标,后两项指标亦为影响患者PFS预后的独立性指标(P=0.033、P<0.001)。亚组分析结果显示放疗剂量较大(≥60 Gy)时,可使管壁最大厚度≤3.7 cm组、食管病变GTV≤37.34 cm3组和未接收同步化疗组患者OS(χ2=5.040、4.588、5.400,P=0.025、0.032、0.020)和PFS(χ2=6.089、4.353、6.459,P=0.014、0.037、0.011)均获益。
结论肿瘤局部因素指标为影响接受根治性放(化)疗食管鳞癌患者的重要预后因素;病变食管壁厚度和肿瘤体积较小的患者可能更能从较高的剂量(≥60 Gy)照射中获益。
Abstract:ObjectiveTo investigate the effect of different radiotherapy doses on the prognosis of patients with stage cT1-4N0M0 esophageal squamous cell carcinoma (ESCC) who received radical radio (chemo)therapy categorized into subgroups with different tumor local factors.
MethodsA retrospective analysis was conducted on 256 patients with clinically nonmetastatic esophageal squamous cell carcinoma. The optimal cutoff for tumor local factors was determined. The relationship between latest treatment efficacy and tumor local factors was analyzed, and independent indicators affecting patient overall survival (OS) were examined using multivariate analysis. The subgroup analysis was performed to determine the correlation between selected factors and radiation therapy doses.
ResultsThe shorter the X-ray length of esophageal tumor lesion and the smaller the lesion canal wall thickness and gross tumor volume (GTV), the better the latest treatment efficacy of the patients (χ2=9.066, 10.310, 15.661, respectively, P=0.011, 0.006, P<0.001). Multivariate analysis results showed that GTV(P<0.001), radiation dose(P=0.038), and latest treatment efficacy(P<0.001) were independent predictors of the patients’ OS, and the latter two were also independent predictors of the patients’ progression-free survival (PFS) (P=0.033, <0.001). Subgroup analysis further showed that high doses of radiotherapy (over 60 Gy) resulted in good OS (χ2=5.040, 4.588, 5.400, P=0.025, 0.032, 0.020) and PFS (χ2=6.089, 4.353, 6.459, P=0.014, 0.037, 0.011) in the subgroup with maximum wall thickness below 3.7 cm, with esophageal lesions with GTV below 37.34 cm3, or not receiving simultaneous chemotherapy.
ConclusionLocal tumor factors are important prognostic factors of ESCC patients treated with radical radio(chemo)therapy. Patients with thin lesion walls and small tumor volumes may greatly benefit from high doses of radiation (over 60 Gy).
-
0 引言
对于不可或不愿接受手术切除的食管癌患者,放疗仍是其局部治疗的主要手段。在免疫治疗时代的今日,放疗仍然是食管癌患者综合治疗模式中主要的治疗模式之一[1-2],但目前在食管癌放疗靶区、处方剂量等方面临床上仍存在一定争议[3-5],尤其是放疗剂量,欧美国家与以中国和日本为代表的的亚非洲国家一直存在着不同的认识。放疗剂量不但与疗效相关,也与治疗的不良反应等相关[6-7],因此对于放疗剂量的要求更加严格。食管癌患者治疗后的主要失败模式为局部区域复发[8-9],肿瘤局部因素对患者的预后影响尤其重要。食管癌局部因素主要指标食管肿瘤病变X线长度、食管病变管壁最大厚度和食管原发病灶病变体积等均可较为准确地获取。近年来,立体定向放疗相关研究表明,高放疗剂量可以给患者带来生存获益[10-11],说明较高的治疗剂量与小而精确的靶区体积结合在一起可以提高患者的预后,因此,临床上我们在关注放疗剂量的同时还应综合靶区体积,不同的靶区体积可能适合不同的放疗剂量。为了明确不同放疗剂量与食管癌局部相关的肿瘤病变长度、肿瘤食管壁最大厚度和肿瘤体积之间的关系及其对患者预后的影响,我们回顾性分析了单中心256例无转移食管鳞癌患者的预后。
1 资料与方法
1.1 入排标准
收集2013年1月至2017年12月于我院接受根治性放(化)疗的食管鳞癌患者的一般临床资料。纳入标准:在我院行电子胃镜检查,且活检病理证实为食管鳞状细胞癌;治疗前基线检查未发现淋巴结和远处脏器转移;依据第六版AJCC食管癌TNM分期标准,入组患者为cT1-4N0M0期患者;KPS评分≥80;患者均以根治性治疗为目的,在我院接受放疗和(或)联合化疗,且放疗处方剂量≥50 Gy;临床病理和随访资料齐全。排除标准:伴有其他部位恶性肿瘤;食管病灶为多中心起源癌;有影响治疗的严重心肺功能障碍;放疗中断时间≥7天。本研究获得本院伦理委员会审核批准(编号:2025ky182)。
1.2 一般临床资料
共256例患者符合入组标准,年龄为43~89岁,中位年龄69岁;男女比例约为 1.78∶1;食管病变位于颈段、胸上段、胸中段和胸下段者分别为13例(5.1%)、66例(25.8%)、127例(49.6%)和50例(19.5%);临床分期cT1、cT2、cT3和cT4期者分别为8例(3.1%)、87例(34.0%)、56例(21.9%)、105例(41.0%)。
1.3 治疗方法
全组患者均接受三维适形或调强适形放射治疗,均行累及野照射(Involved-field irradiation, IFI),勾画食管肿瘤大体肿瘤体积(Gross tumor volume, GTV),在GTV基础上,上下方向外扩2~3 cm、前后左右方向外扩0.5~1.0 cm为临床肿瘤体积(Clinical tumor volume, CTV),在CTV基础上,上下方向外扩1.0~2.0 cm、前后左右方向外扩0.5 cm为计划肿瘤体积(Plan tumor volume, PTV)。照射剂量为50~64 Gy,中位60 Gy。正常组织的剂量:双肺平均剂量≤13 Gy、V20≤28%、V30≤18%;心脏平均剂量≤24 Gy、V30≤40%、V40≤30%;脊髓最大剂量≤45 Gy。外扩范围及处方剂量由主管医生依据患者年龄、性别、体质状况、病变体积大小、长度、与周边重要组织/器官关系、联合治疗情况以及双肺体积等来决定。全组共51例患者接受了同步化疗。化疗周期数为2~6个,中位数4个;其中17.6%患者使用顺铂+氟尿嘧啶方案, 82.4%患者使用紫杉醇+顺铂方案。
1.4 肿瘤局部因素及测量方法
食管病变X线长度:主要依据患者治疗前基线检查的食管钡餐造影X线片显示的病变长度进行测量;食管病变食管壁最厚处大小:主要依据胸部定位强化CT扫描所显示的食管癌最大病变横断层面进行测量;GTV大小:依据放疗科医师勾画的GTV,并由治疗计划系统自动计算。
1.5 疗效评价标准
在放疗后1~3个月进行患者近期疗效评价。依据日本食管癌实践指南评价标准[12]分为:(1)完全缓解(Complete response, CR):食管病灶完全消失,钡剂可完全通过,食管管腔有轻微狭窄或无狭窄,食管黏膜增厚,管壁有点僵硬;(2)部分缓解(Partial response, PR):病灶消失≥30%,无腔外溃疡和食管变形,钡剂可以完全通过,边缘食道不够光滑,小壁龛可以被观察到;(3)疾病稳定(Stable disease, SD):病变无显著性减少,食管充盈缺损明显,管腔狭窄严重;(4)疾病进展(Progressive disease, PD):观察到明显的新病变。
1.6 随访
随访方式以电话随访、门诊复查为主,第1年每1~6月复查1次,第2年每3~6月复查1次,随后每6~12个月复查1次。 随访截止日期为2021年12月31日。
1.7 统计学方法
采用SPSS 25.0统计软件进行数据分析。计数资料之间的采用χ2检验;Kaplan-Meier法计算总生存(Overall survival, OS)率,Log-rank法和单因素分析预后影响因素,多因素分析采用Cox比例风险模型分析OS的预后影响因素;相关性分析采用Spearman等级相关;以食管病变X线长度、食管病变管壁最大厚度和GTV大小为检验变量,患者生存情况为状态变量,绘制受试者工作特征( Receiver operating characteristic,ROC)曲线,以评估三者对患者预后的预测能力。以P<0.05为差异有统计学意义。
2 结果
2.1 肿瘤食管病变X线长度、食管病变食管壁最厚处大小和GTV大小分析结果
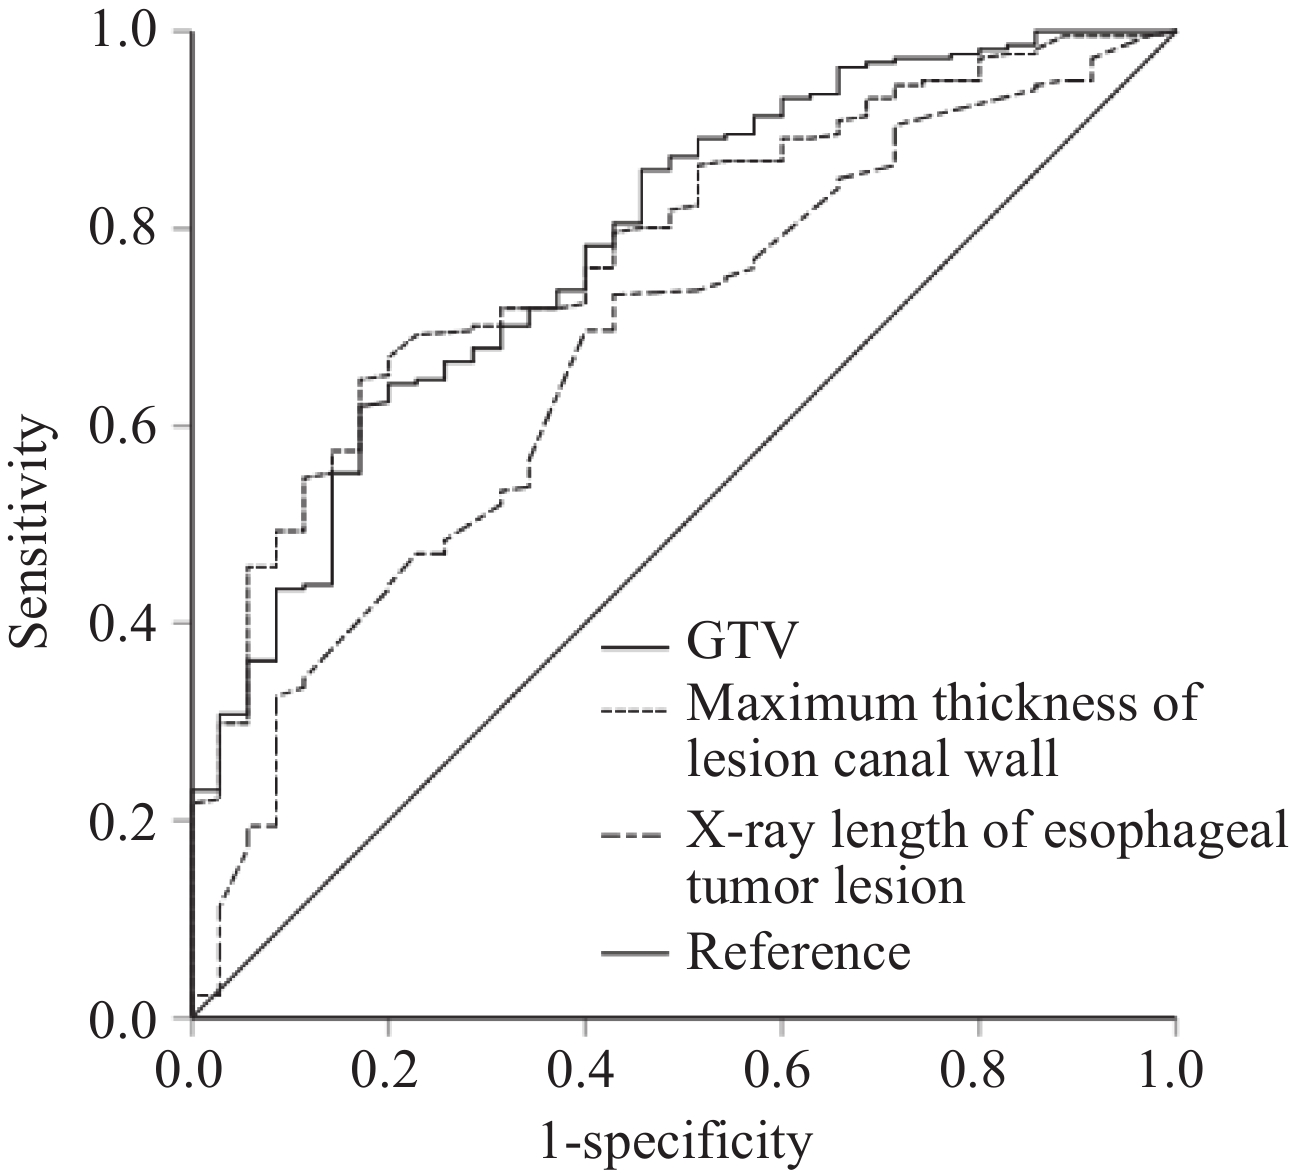
以患者的生存情况为状态变量,并定义状态为1,以肿瘤食管病变X线长度、食管病变食管壁最厚处大小和GTV大小三个指标值为协变量进行ROC曲线分析,得出各自预测患者预后的最佳截止值,并得出曲线下面积值,结果显示三个指标均可很好的预测患者的预后,见表1、图1。
表 1 肿瘤局部因素和患者预后ROC曲线分析结果Table 1 Local tumor factors and ROC curve analysis for prognosisVariable Minimum Maximum Median Mean Optimal cutoff AUC P Sensitivity Specificity X-ray length of esophageal
tumor lesion1.8 cm 15.7 cm 5.4 cm 5.7 cm 4.6 cm 0.674 0.001 73.3% 48.6% Maximum thickness of lesion
canal wall1.5 cm 8.5 cm 3.9 cm 4.0 cm 3.7 cm 0.782 <0.001 64.7% 82.9% GTV 6.74 cm3 265.21 cm3 39.48 cm3 51.86 cm3 37.34 cm3 0.784 <0.001 62.0% 83.6% ![]() 图 1 食管鳞状细胞癌患者预后肿瘤局部因素ROC曲线图Figure 1 ROC curves of local tumor factors for prognosis prediction of patients with esophageal squamous cell carcinoma
图 1 食管鳞状细胞癌患者预后肿瘤局部因素ROC曲线图Figure 1 ROC curves of local tumor factors for prognosis prediction of patients with esophageal squamous cell carcinoma2.2 近期疗效分析结果
全组患者治疗结束后近期疗效为CR、PR和SD的分别为79例(30.9%)、162例(63.3%)和15例(5.9%)。将患者肿瘤局部因素与近期疗效进行分析,结果显示病变X线长度越短、食管壁最大厚度和GTV越小则患者近期疗效均显著优于较大组患者(均P<0.05),见表2。
表 2 近期疗效与食管肿瘤局部因素之间关系的卡方检验分析结果 (n(%))Table 2 Relation between recent treatment efficacy and local tumor factors (n (%))Efficacy X-ray length of esophageal tumor lesion Maximum thickness of lesion canal wall GTV ≤4.6 cm >4.6 cm ≤3.7 cm >3.7 cm ≤37.34 cm3 >37.34 cm3 CR 34 (43.0) 45 (57.0) 41 (51.9) 38 (48.1) 46 (58.2) 33 (41.8) PR 43 (26.5) 119 (73.5) 58 (35.8) 104 (64.2) 66 (40.7) 96 (59.3) SD 2 (13.3) 13 (86.7) 2 (13.3) 13 (86.7) 1 (6.7) 14 (93.3) χ2 9.066 10.310 15.661 P 0.011 0.006 <0.001 2.3 全组患者生存分析结果
全组患者1、3、5年OS率和PFS率分别为79.3%、41.3%、19.5%和64.5%、31.6%、15.4%;中位OS和PFS时间分别为27.0个月(95%CI: 21.7~32.3)和18.9个月(95%CI: 14.7~23.1)。将可能影响患者预后的各项临床病理指标纳入Cox多因素分析模型,结果显示食管病变GTV、处方剂量和近期疗效等3项指标为影响患者OS预后的独立性指标(P=<0.001、0.038、<0.001);而处方剂量和近期疗效2项指标为影响患者PFS预后的独立性指标(P=0.033、<0.001),见表3。
表 3 影响患者预后的多因素分析结果Table 3 Multivariate analysis of factors affecting patients’ prognosisFactors Regression coefficient S Chi-square P OB 95%CI OS GTV 0.572 0.144 15.865 <0.001 1.771 1.337-2.346 Radiation dose −0.518 0.249 4.323 0.038 0.595 0.365-0.971 Recent treatment efficacy 0.611 0.135 20.425 <0.001 1.843 1.414-2.403 PFS Radiation dose −0.329 0.159 4.297 0.033 0.719 0.527-0.982 Recent treatment efficacy 0.748 0.158 22.541 <0.001 2.112 1.551-2.876 2.4 接受不同处方剂量的亚组分析结果
依据处方剂量将不同指标下的患者分为2组,结果显示食管壁最大厚度≤3.7 cm组、食管病变GTV≤37.34 cm3组和未接收同步化疗组患者在接受≥60 Gy剂量照射后长期OS率和PFS率均可获益(均P<0.05),见表4。
表 4 各项临床特征接受不同处方剂量的亚组分析结果Table 4 Analysis of the effects of different radiation doses in subgroupsVariable Dose
(Gy)N OS (%) Median
(month)χ2 P PFS (%) Median
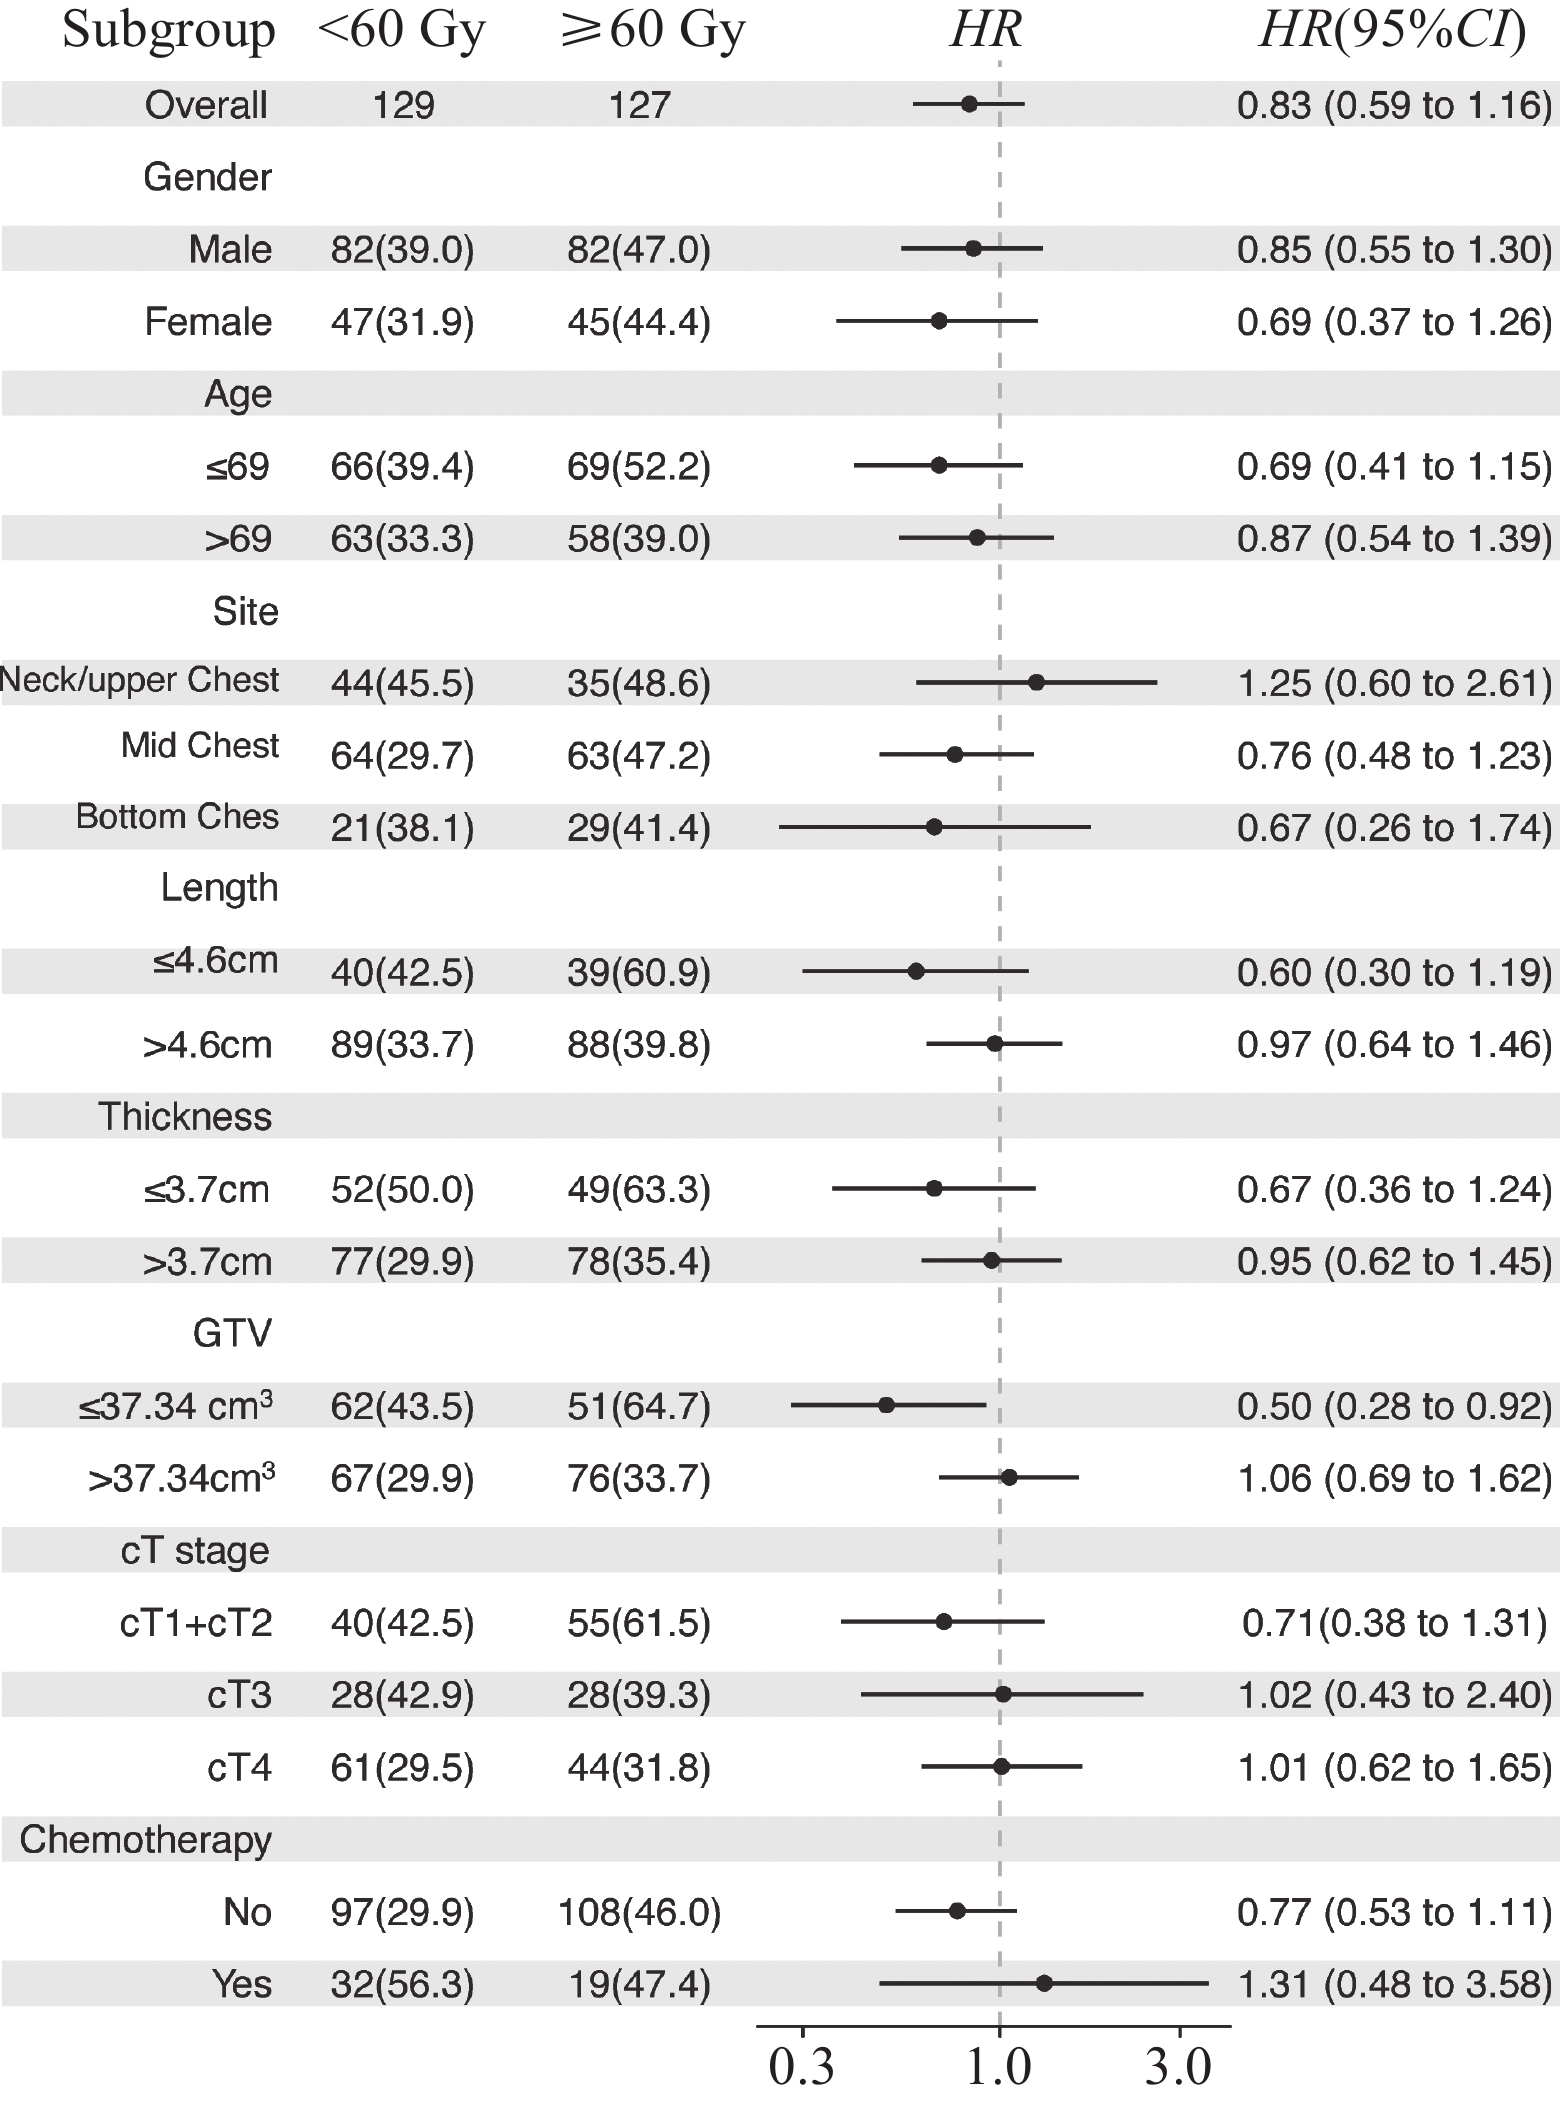
(month)χ2 P 3-year 5-year 3-year 5-year Gender Male <60 82 39.0 14.8 24.3 0.877 0.349 25.6 12.7 16.0 1.229 0.268 ≥60 82 47.0 21.0 31.1 39.0 17.1 20.0 Female <60 47 31.9 15.3 25.2 2.169 0.141 23.4 11.8 18.0 2.651 0.104 ≥60 45 44.4 28.4 29.4 37.8 20.0 23.1 Age (years) ≤69 <60 66 39.4 23.0 25.5 0.495 0.482 30.3 17.7 18.3 1.273 0.259 ≥60 69 52.2 28.0 41.4 44.9 22.6 30.0 >69 <60 63 33.3 6.8 23.0 2.956 0.086 19.0 7.1 18.0 2.289 0.103 ≥60 58 39.0 18.6 24.8 31.0 3.2 18.0 Location Cervical/upper thoracic <60 44 45.5 14.0 29.0 0.609 0.435 29.5 10.7 19.2 0.835 0.361 ≥60 35 48.6 17.1 32.4 40.0 17.1 27.7 Middle thoracic <60 64 29.7 18.4 23.0 1.983 0.159 21.9 14.7 14.6 2.110 0.146 ≥60 63 47.2 27.5 31.6 39.7 17.4 21.9 Lower thoracic <60 21 38.1 15.9 25.5 0.252 0.616 23.8 7.9 22.8 0.607 0.436 ≥60 29 41.4 24.1 26.0 34.5 20.7 23.1 X-ray length of esophageal tumor lesion (cm) ≤4.6 <60 40 42.5 18.8 29.5 1.820 0.177 27.5 11.3 18.0 3.507 0.061 ≥60 39 60.9 32.3 47.6 51.3 24.2 37.0 >4.6 <60 89 33.7 13.6 21.9 1.524 0.217 23.6 13.4 16.0 0.940 0.332 ≥60 88 39.8 20.1 24.0 33.0 15.6 18.3 Maximum thickness of lesion canal wall (cm) ≤3.7 <60 52 50.0 17.8 29.5 5.040 0.025 25.0 14.0 18.9 6.089 0.014 ≥60 49 63.3 37.2 48.7 55.1 27.1 39.0 >3.7 <60 77 29.9 13.3 21.9 0.094 0.759 24.7 11.3 15.2 0.210 0.647 ≥60 78 35.4 15.7 23.1 28.2 12.8 18.2 GTV (cm3) ≤37.34 <60 62 43.5 20.4 29.5 4.588 0.032 27.4 15.2 20.0 4.353 0.037 ≥60 51 64.7 36.1 49.8 52.9 23.9 37.4 >37.34 <60 67 29.9 10.5 20.0 0.382 0.537 22.4 10.1 14.6 0.843 0.359 ≥60 76 33.7 16.2 19.0 28.9 14.5 18.0 cT stage cT1+cT2 <60 40 42.5 26.0 29.5 0.666 0.414 27.5 21.7 20.0 0.460 0.498 ≥60 55 61.5 32.3 48.2 50.9 22.4 37.0 cT3 <60 28 42.9 15.3 27.2 0.333 0.564 32.1 10.7 20.0 0.088 0.767 ≥60 28 39.3 12.5 24.8 32.1 14.3 22.0 cT4 <60 61 29.5 7.4 19.2 1.162 0.281 19.7 6.6 12.9 2.737 0.098 ≥60 44 31.8 20.0 18.8 27.3 15.9 18.2 Chemotherapy No <60 97 29.9 11.3 23.0 5.400 0.020 22.7 9.3 15.8 6.459 0.011 ≥60 108 46.0 23.0 31.1 39.8 18.2 23.1 Yes <60 32 56.3 27.3 38.8 0.001 0.979 31.3 23.4 18.9 0.024 0.877 ≥60 19 47.4 27.6 26.0 31.6 18.9 14.0 应用Cox多因素回归分析,求出相关指标各亚组的HR和置信区间,应用R语言RStudio forestploter制作森林图,见图2。
![]() 图 2 患者临床特征与放疗剂量关系的森林图Figure 2 Forest plot of the association between clinical characteristics and radiation dose
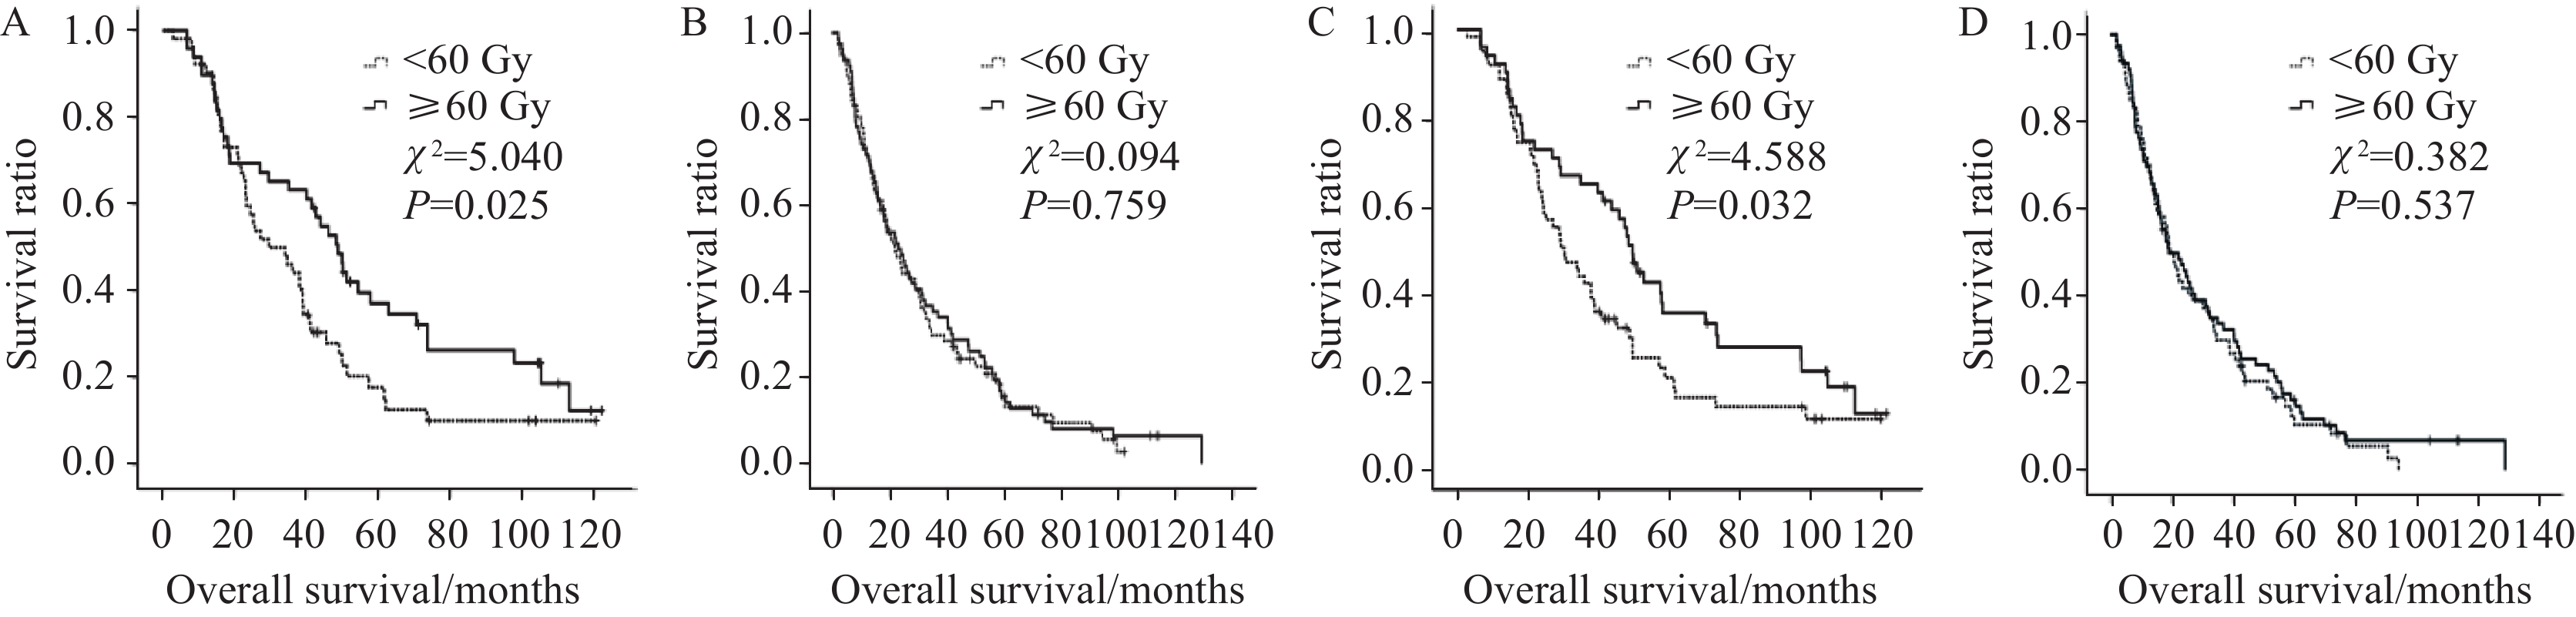
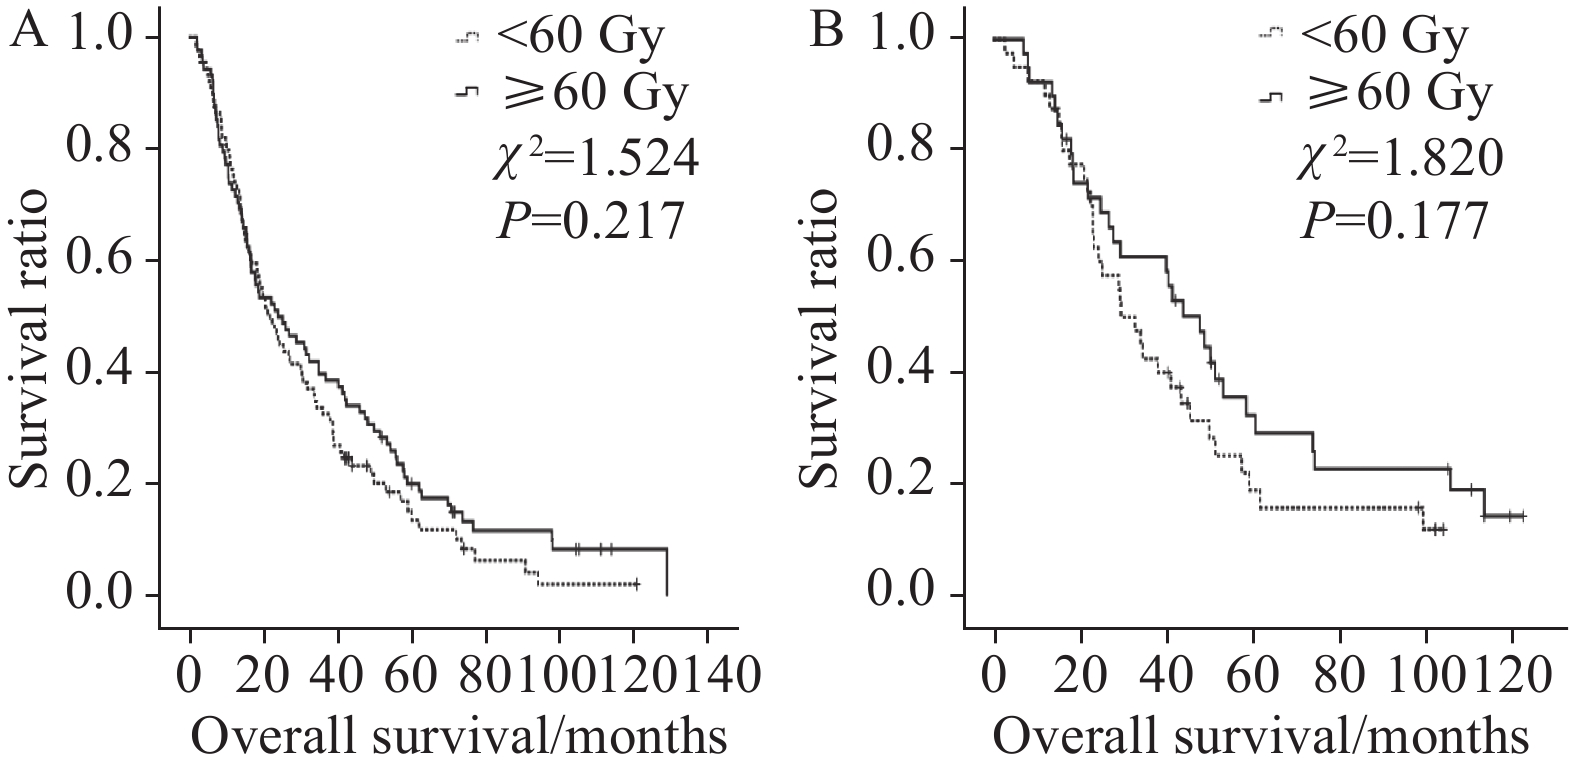
图 2 患者临床特征与放疗剂量关系的森林图Figure 2 Forest plot of the association between clinical characteristics and radiation dose从以上表格中可知食管壁最大厚度和GTV越小组患者3、5年OS率和PFS率均可以从≥60 Gy剂量中获益,而食管壁厚度和食管病变GTV较大组患者不能从放疗剂量的提升中获益,见图3。接受同步化疗患者的3、5年OS率和PFS率亦不能从较高剂量的照射中获益,而仅接受根治性放射治疗的患者则可从≥60 Gy剂量中获益,见图4。
![]() 图 3 不同放疗剂量对食管壁最大厚度≤3.7 cm(A)或>3.7 cm组(B)患者以及对食管病变GTV≤37.34 cm3(C)或>37.34 cm3组(D)患者预后影响生存曲线图Figure 3 Kaplan-Meier plot of comparing patients treated with radiation dose below and over 60 Gy with maximum thickness of lesion canal wall ≤ 3.7 cm (A) or > 3.7 cm (B) and Kaplan-Meyer plot comparing patients treated with radiation dose below and over 60 Gy with GTV ≤37.34 cm3 (C) and > 37.34 cm3 (D)
图 3 不同放疗剂量对食管壁最大厚度≤3.7 cm(A)或>3.7 cm组(B)患者以及对食管病变GTV≤37.34 cm3(C)或>37.34 cm3组(D)患者预后影响生存曲线图Figure 3 Kaplan-Meier plot of comparing patients treated with radiation dose below and over 60 Gy with maximum thickness of lesion canal wall ≤ 3.7 cm (A) or > 3.7 cm (B) and Kaplan-Meyer plot comparing patients treated with radiation dose below and over 60 Gy with GTV ≤37.34 cm3 (C) and > 37.34 cm3 (D)![]() 图 4 不同剂量对接受同步化疗组(A)和未接受同步化疗组(B)患者预后影响生存曲线图Figure 4 Kaplan-Meier plot of effect of different radiation dose on prognosis of patients treated with (A) or without (B) concurrent chemotherapy
图 4 不同剂量对接受同步化疗组(A)和未接受同步化疗组(B)患者预后影响生存曲线图Figure 4 Kaplan-Meier plot of effect of different radiation dose on prognosis of patients treated with (A) or without (B) concurrent chemotherapy3 讨论
肿瘤局部因素一直是临床医师所关注的重点问题[13-15],对于接受放疗的恶性肿瘤患者,其放疗靶区范围取决于原发肿瘤的大小,而放疗靶区范围是临床主要的剂量限制性因素之一,且与治疗相关不良反应密切相关[16-17]。传统观念中,原发肿瘤较大的患者可能需要较大的放疗剂量来杀灭肿瘤细胞。然而,临床实际中,早期肿瘤体积小,血运好,乏氧细胞少或无,对放疗敏感而易于被杀灭;当肿瘤已属晚期,体积增大,肿瘤血运较差,乏氧细胞增多,有时甚至出现中心部缺氧坏死、液化,放疗敏感性则降低,治疗效果差[18-19],使得临床中即使予以肿瘤体积较大患者较高的放疗剂量也不一定能提高患者的肿瘤控制率。目前,放疗剂量与肿瘤局部控制的关系尚未形成共识[20-21]。本研究为明确食管癌原发肿瘤局部因素与放疗剂量之间的关系,也为了排除转移淋巴结对原发肿瘤局部因素的影响,仅对256例临床无转移且接受根治性放(化)疗的食管癌患者进行了回顾性分析,结果显示与食管原发肿瘤紧密相关的局部因素−食管钡餐造影X线显示的食管病变长度、胸部强化CT扫描显示的肿瘤层面食管壁最大厚度和治疗计划计算所得的GTV大小均可以显著性预测患者预后,且与患者治疗后的近期疗效显著性相关,多因素分析结果显示食管原发肿瘤GTV大小为影响本组患者OS的独立性因素,这与既往多项研究结果一致[22-25]。为明确肿瘤局部因素与放疗剂量对患者预后的影响,我们进行了亚组分析,结果显示对于食管肿瘤管壁厚度和GTV较小患者使用较高的放疗剂量可以提高其长期OS率和PFS率。
食管原发肿瘤GTV大小为食管癌患者主要预后影响因素之一,这在相关研究中已得到证实,但由于各研究中心入组患者的食管肿瘤病变部位、分期早晚、治疗方式及测量方式等诸多方面的不同,导致现有研究报道中对于GTV的最佳分界值不尽相同,目前对于食管癌病变GTV最佳预测值也无统一的标准[26]。Chen等[27]对568例胸上段食管癌患者的原发肿瘤大小对患者预后影响情况进行了分析,其中接受手术、放疗、手术联合放疗的患者分别为238、216和114例,经倾向性匹配分析后,结果显示GTV大小为本组患者的独立性预后影响因素,GTV以30 cm3为分界值时,两组患者5年OS率和PFS率差异均有显著性。Li等[25]研究显示对于pT3N0M0食管鳞癌患者,GTV≤18.6 cm3患者的5年OS率优于GTV>18.6 cm3的患者(85% vs. 50%,P=0.008)。而Favareto等[22]的研究显示,GTV大小的最佳分界值为28 cm3。遗憾的是以上几项研究均未将不同GTV大小与不同放疗剂量进行分层分析。本研究,我们将GTV以37.34 cm3为分界值,GTV≤37.34 cm3组患者的预后显著性优于GTV>37.34 cm3组,且≤37.34 cm3组患者接受剂量越高则预后越好,这可能与GTV较小接受较大剂量照射后可以取得较好的肿瘤消退有关。目前,关于食管病变消退情况与患者预后的关系也有相关报道。Huang等[28]对53例接受放化疗的食管癌患者进行了分析,结果显示GTV≤20 cm3、接受20次放疗后GTV消退比率≥35%为患者OS较好的独立性预测指标,且治疗前GTV≤20 cm3为患者局控较好的独立性预测指标。Wongwaiyut等[24]对80例接受同步放化疗食管癌患者的预后情况进行了分析,其中20例患者接受新辅助放化疗,另60例患者接受根治性放化疗,结果显示接受新辅助放化疗的患者中,病理完全缓解组患者病变食管壁的厚度显著性小于未达完全缓解组患者(11.9±5.3 mm vs. 16.9±3 mm,P=0.01),且食管壁厚度较大患者的中位OS时间显著性低于较小者(79个月 vs. 15 个月,P=0.02)。其他相关研究也同样认为食管壁厚度或和其治疗前后的缩小率可以有效的预测患者的预后[25,29-30]。关于肿瘤治疗后的近期疗效与肿瘤局部因素的关系,我们的研究结果显示,食管病变越短、肿瘤食管管壁厚度越小和GTV越小组患者取得的近期疗效越好。
本研究结果亦显示患者治疗后疗效为患者预后独立性影响因素,进一步研究结果显示不同食管原发灶长度、病变食管壁最大厚度及GTV大小显著影响患者的近期疗效,且病变较短、厚度和体积较小则具有较高比率的完全缓解和部分缓解率。目前相关研究均显示,无论针对于接受新辅助放化疗食管癌患者或拟接受根治性放(化)疗患者,食管肿瘤局部因素均与治疗疗效显著性相关[21,29-30]。Qin等[14]对
1450 例T3N1M0/T4N0-1M0食管癌患者进行了回顾性分析,多因素分析结果显示GTV和近期疗效为影响患者OS和PFS的独立性预后指标。Chen等[31]对87例接受放化疗的食管癌患者进行了回顾性分析,结果显示治疗后近期疗效不佳为该组患者预后不良和局部复发的唯一独立性预测指标。本研究结果与上述研究结果相似。关于接受根治性放(化)疗食管癌患者的放射治疗剂量一直是比较有争议的热点问题,欧美国家多数研究支持的食管癌患者剂量为50.4 Gy,而以中国和日本为代表的亚洲和非洲国家则认为剂量应该≥60 Gy[32-35]。这些研究主要针对的是入组患者全体,而针对不同群体接受不同剂量照射后受益程度的分层研究少见。对于接受根治性放(化)疗的食管癌患者,统一的放疗剂量可能不适合所有的人群。同多数研究相似,我们的结果显示放射治疗剂量为影响患者OS和PFS的独立性因素。进一步分层分析显示,并不是所有患者均可以从≥60 Gy的剂量中获益,食管原发肿瘤食管壁厚度较小、GTV较小和单纯放疗患者可以从中获益。但也有与本研究结论相反的研究,Lin等[21]回顾性分析了124例接受同步放化疗的Ⅲ期食管鳞癌患者预后,患者的GTV大小分界值为55.3 cm3,结果显示近期疗效较差患者的GTV显著大于较好组患者(97.9 cm3 vs. 64.3 cm3,P=0.032);GTV较大组患者的局部控制率和生存率均显著逊于GTV较小组患者,但该研究同时显示GTV≥55.3 cm3的患者中,增加放疗剂量(>60 Gy vs. ≤60 Gy)能延长其局部进展时间(20.3月 vs. 10.1月,P=0.036)和中位OS时间(12.2月 vs. 8.0 月,P=0.030)。进一步分析可能与以下因素有关:该研究的入组人群均为Ⅲ期,且均存在淋巴结转移,其GTV大小包括食管原发肿瘤和转移淋巴结;该研究计算放疗剂量针对的是GTV,而非传统的PTV;接受60 Gy剂量照射的患者被纳入了较小剂量组。与本研究存在一定的人群差异。
本研究存在一定的局限性:本研究为回顾性,其固有的偏倚不可避免;将淋巴结转移患者排除在外,减少了淋巴结转移对原发灶GTV大小的影响,但对于淋巴结转移患者需要进一步的研究;只有部分患者接受了同步化疗,可能在一定程度上会影响对患者预后的分析;近期疗效评价主要依靠食管造影,如加入超声内镜或PET/CT来评估患者的预后可能更为准确。
综上所述,食管鳞癌肿瘤局部因素指标为影响接受根治性放(化)疗食管鳞癌患者的重要预后因素;对病变食管壁厚度和原发肿瘤体积大小不同的患者应予以不同的放疗剂量;病变食管壁厚度和肿瘤体积较小的患者可更能从较高的剂量照射中获益。对于局部复发风险较高或远处转移风险较低的局部晚期食管癌患者,采用个体化放疗的剂量仍值得进一步研究。
致谢:感谢本次科研及论文协作过程中所有参与者及科室同事的指导和大力支持。
Competing interests: The authors declare that they have no competing interests.利益冲突声明:所有作者均声明不存在利益冲突。作者贡献:孔雁、李曙光:实验设计、文章撰写董倩、许金蕊:数据分析、图片制作赵小涵、邓文钊:数据收集与整理沈文斌:研究指导、论文审阅、经费支持 -
![]()
图 1 食管鳞状细胞癌患者预后肿瘤局部因素ROC曲线图
Figure 1 ROC curves of local tumor factors for prognosis prediction of patients with esophageal squamous cell carcinoma
![]()
图 2 患者临床特征与放疗剂量关系的森林图
Figure 2 Forest plot of the association between clinical characteristics and radiation dose
![]()
图 3 不同放疗剂量对食管壁最大厚度≤3.7 cm(A)或>3.7 cm组(B)患者以及对食管病变GTV≤37.34 cm3(C)或>37.34 cm3组(D)患者预后影响生存曲线图
Figure 3 Kaplan-Meier plot of comparing patients treated with radiation dose below and over 60 Gy with maximum thickness of lesion canal wall ≤ 3.7 cm (A) or > 3.7 cm (B) and Kaplan-Meyer plot comparing patients treated with radiation dose below and over 60 Gy with GTV ≤37.34 cm3 (C) and > 37.34 cm3 (D)
![]()
图 4 不同剂量对接受同步化疗组(A)和未接受同步化疗组(B)患者预后影响生存曲线图
Figure 4 Kaplan-Meier plot of effect of different radiation dose on prognosis of patients treated with (A) or without (B) concurrent chemotherapy
表 1 肿瘤局部因素和患者预后ROC曲线分析结果
Table 1 Local tumor factors and ROC curve analysis for prognosis
Variable Minimum Maximum Median Mean Optimal cutoff AUC P Sensitivity Specificity X-ray length of esophageal
tumor lesion1.8 cm 15.7 cm 5.4 cm 5.7 cm 4.6 cm 0.674 0.001 73.3% 48.6% Maximum thickness of lesion
canal wall1.5 cm 8.5 cm 3.9 cm 4.0 cm 3.7 cm 0.782 <0.001 64.7% 82.9% GTV 6.74 cm3 265.21 cm3 39.48 cm3 51.86 cm3 37.34 cm3 0.784 <0.001 62.0% 83.6%  下载: 导出CSV
表 2 近期疗效与食管肿瘤局部因素之间关系的卡方检验分析结果 (n(%))
Table 2 Relation between recent treatment efficacy and local tumor factors (n (%))
Efficacy X-ray length of esophageal tumor lesion Maximum thickness of lesion canal wall GTV ≤4.6 cm >4.6 cm ≤3.7 cm >3.7 cm ≤37.34 cm3 >37.34 cm3 CR 34 (43.0) 45 (57.0) 41 (51.9) 38 (48.1) 46 (58.2) 33 (41.8) PR 43 (26.5) 119 (73.5) 58 (35.8) 104 (64.2) 66 (40.7) 96 (59.3) SD 2 (13.3) 13 (86.7) 2 (13.3) 13 (86.7) 1 (6.7) 14 (93.3) χ2 9.066 10.310 15.661 P 0.011 0.006 <0.001
下载: 导出CSV
表 3 影响患者预后的多因素分析结果
Table 3 Multivariate analysis of factors affecting patients’ prognosis
Factors Regression coefficient S Chi-square P OB 95%CI OS GTV 0.572 0.144 15.865 <0.001 1.771 1.337-2.346 Radiation dose −0.518 0.249 4.323 0.038 0.595 0.365-0.971 Recent treatment efficacy 0.611 0.135 20.425 <0.001 1.843 1.414-2.403 PFS Radiation dose −0.329 0.159 4.297 0.033 0.719 0.527-0.982 Recent treatment efficacy 0.748 0.158 22.541 <0.001 2.112 1.551-2.876
下载: 导出CSV
表 4 各项临床特征接受不同处方剂量的亚组分析结果
Table 4 Analysis of the effects of different radiation doses in subgroups
Variable Dose
(Gy)N OS (%) Median
(month)χ2 P PFS (%) Median
(month)χ2 P 3-year 5-year 3-year 5-year Gender Male <60 82 39.0 14.8 24.3 0.877 0.349 25.6 12.7 16.0 1.229 0.268 ≥60 82 47.0 21.0 31.1 39.0 17.1 20.0 Female <60 47 31.9 15.3 25.2 2.169 0.141 23.4 11.8 18.0 2.651 0.104 ≥60 45 44.4 28.4 29.4 37.8 20.0 23.1 Age (years) ≤69 <60 66 39.4 23.0 25.5 0.495 0.482 30.3 17.7 18.3 1.273 0.259 ≥60 69 52.2 28.0 41.4 44.9 22.6 30.0 >69 <60 63 33.3 6.8 23.0 2.956 0.086 19.0 7.1 18.0 2.289 0.103 ≥60 58 39.0 18.6 24.8 31.0 3.2 18.0 Location Cervical/upper thoracic <60 44 45.5 14.0 29.0 0.609 0.435 29.5 10.7 19.2 0.835 0.361 ≥60 35 48.6 17.1 32.4 40.0 17.1 27.7 Middle thoracic <60 64 29.7 18.4 23.0 1.983 0.159 21.9 14.7 14.6 2.110 0.146 ≥60 63 47.2 27.5 31.6 39.7 17.4 21.9 Lower thoracic <60 21 38.1 15.9 25.5 0.252 0.616 23.8 7.9 22.8 0.607 0.436 ≥60 29 41.4 24.1 26.0 34.5 20.7 23.1 X-ray length of esophageal tumor lesion (cm) ≤4.6 <60 40 42.5 18.8 29.5 1.820 0.177 27.5 11.3 18.0 3.507 0.061 ≥60 39 60.9 32.3 47.6 51.3 24.2 37.0 >4.6 <60 89 33.7 13.6 21.9 1.524 0.217 23.6 13.4 16.0 0.940 0.332 ≥60 88 39.8 20.1 24.0 33.0 15.6 18.3 Maximum thickness of lesion canal wall (cm) ≤3.7 <60 52 50.0 17.8 29.5 5.040 0.025 25.0 14.0 18.9 6.089 0.014 ≥60 49 63.3 37.2 48.7 55.1 27.1 39.0 >3.7 <60 77 29.9 13.3 21.9 0.094 0.759 24.7 11.3 15.2 0.210 0.647 ≥60 78 35.4 15.7 23.1 28.2 12.8 18.2 GTV (cm3) ≤37.34 <60 62 43.5 20.4 29.5 4.588 0.032 27.4 15.2 20.0 4.353 0.037 ≥60 51 64.7 36.1 49.8 52.9 23.9 37.4 >37.34 <60 67 29.9 10.5 20.0 0.382 0.537 22.4 10.1 14.6 0.843 0.359 ≥60 76 33.7 16.2 19.0 28.9 14.5 18.0 cT stage cT1+cT2 <60 40 42.5 26.0 29.5 0.666 0.414 27.5 21.7 20.0 0.460 0.498 ≥60 55 61.5 32.3 48.2 50.9 22.4 37.0 cT3 <60 28 42.9 15.3 27.2 0.333 0.564 32.1 10.7 20.0 0.088 0.767 ≥60 28 39.3 12.5 24.8 32.1 14.3 22.0 cT4 <60 61 29.5 7.4 19.2 1.162 0.281 19.7 6.6 12.9 2.737 0.098 ≥60 44 31.8 20.0 18.8 27.3 15.9 18.2 Chemotherapy No <60 97 29.9 11.3 23.0 5.400 0.020 22.7 9.3 15.8 6.459 0.011 ≥60 108 46.0 23.0 31.1 39.8 18.2 23.1 Yes <60 32 56.3 27.3 38.8 0.001 0.979 31.3 23.4 18.9 0.024 0.877 ≥60 19 47.4 27.6 26.0 31.6 18.9 14.0
下载: 导出CSV
-
[1] Park S, Oh D, Choi YL, et al. Durvalumab and tremelimumab with definitive chemoradiotherapy for locally advanced esophageal squamous cell carcinoma[J]. Cancer, 2022, 128(11): 2148-2158. doi: 10.1002/cncr.34176
[2] Wei T, Ti W, Song Q, et al. Study of PD-1 Inhibitors in Combination with Chemoradiotherapy/Chemotherapy in Patients with Esophageal Squamous Carcinoma[J]. Curr Oncol, 2022, 29(5): 2920-2927. doi: 10.3390/curroncol29050238
[3] Zhu H, Rivin Del Campo E, Ye J, et al. Involved-Field Irradiation in Definitive Chemoradiotherapy for Locoregional Esophageal Squamous Cell Carcinoma: Results From the ESO-Shanghai 1 Trial[J]. Int J Radiat Oncol Biol Phys, 2021, 110(5): 1396-1406. doi: 10.1016/j.ijrobp.2021.02.053
[4] Li M, Zhang X, Zhao F, et al. Involved-field radiotherapy for esophageal squamous cell carcinoma: theory and practice[J]. Radiat Oncol, 2016, 11: 18. doi: 10.1186/s13014-016-0589-7
[5] Chow R, Lock M, Lee SL, et al. Esophageal Cancer Radiotherapy Dose Escalation Meta Regression Commentary: "High vs. Low Radiation Dose of Concurrent Chemoradiotherapy for Esophageal Carcinoma With Modern Radiotherapy Techniques: A Meta-Analysis"[J]. Front Oncol, 2021, 11: 700300. doi: 10.3389/fonc.2021.700300
[6] Zhang W, Xie Q, Zhu B, et al. Intensity-modulated radiotherapy with more than 60 Gy improved the survival of inoperable patients with locally advanced esophageal squamous cell carcinoma: A population-based real-world study[J]. Medicine (Baltimore), 2022, 101(16): e29166. doi: 10.1097/MD.0000000000029166
[7] Huang BT, Huang RH, Zhang WZ, et al. Different definitions of esophagus influence esophageal toxicity prediction for esophageal cancer patients administered simultaneous integrated boost versus standard-dose radiation therapy[J]. Sci Rep, 2017, 7(1): 120. doi: 10.1038/s41598-017-00168-x
[8] Chen NB, Qiu B, Zhang J, et al. Intensity-Modulated Radiotherapy versus Three-Dimensional Conformal Radiotherapy in Definitive Chemoradiotherapy for Cervical Esophageal Squamous Cell Carcinoma: Comparison of Survival Outcomes and Toxicities[J]. Cancer Res Treat, 2020, 52(1): 31-40. doi: 10.4143/crt.2018.624
[9] Zhang J, Zhang W, Zhang B, et al. Clinical results of intensity-modulated radiotherapy for 250 patients with cervical and upper thoracic esophageal carcinoma[J]. Cancer Manag Res, 2019, 11: 8285-8294. doi: 10.2147/CMAR.S203575
[10] Hermann RM, Kober L, Christiansen H. Stereotactic body radiation therapy: radiobiological characteristics, physical-technical prerequisites, clinical applications[J]. Radiologe, 2021, 61(9): 853-862. doi: 10.1007/s00117-021-00903-6
[11] Shioyama Y, Onishi H, Takayama K, et al. Clinical Outcomes of Stereotactic Body Radiotherapy for Patients With Stage I Small-Cell Lung Cancer: Analysis of a Subset of the Japanese Radiological Society Multi-Institutional SBRT Study Group Database[J]. Technol Cancer Res Treat, 2018, 17: 1533033818783904.
[12] Kitagawa Y, Uno T, Oyama T, et al. Esophageal cancer practice guidelines 2017 edited by the Japan Esophageal Society: part 1[J]. Esophagus, 2019, 16(1): 1-24. doi: 10.1007/s10388-018-0641-9
[13] Shen WB, Zhu SC, Gao HM, et al. Analysis of failure patterns in patients with resectable esophageal squamous cell carcinoma receiving chemoradiotherapy[J]. J Cancer Res Ther, 2016, 12(1): 62-68. doi: 10.4103/0973-1482.146128
[14] Qin Q, Ge X, Wang X, et al. Stage Ⅲ Esophageal Squamous Cell Carcinoma Patients With Three-Dimensional Conformal or Intensity-Modulated Radiotherapy: A Multicenter Retrospective Study[J]. Front Oncol, 2020, 10: 580450. doi: 10.3389/fonc.2020.580450
[15] Jiang N, Ge XL, Zhang ZY, et al. Prognostic Factors for Patients with Esophageal Cancer Receiving Definitive Radiotherapy Alone: A Retrospective Analysis[J]. Cancer Manag Res, 2021, 13: 3229-3234. doi: 10.2147/CMAR.S300672
[16] Bütof R, Löck S, Soliman M, et al. Dose-volume predictors of early esophageal toxicity in non-small cell lung cancer patients treated with accelerated-hyperfractionated radiotherapy[J]. Radiother Oncol, 2020, 143: 44-50. doi: 10.1016/j.radonc.2019.11.002
[17] Zhao J, Lei T, Zhang T, et al. The efficacy and safety of simultaneous integrated dose reduction in clinical target volume with intensity-modulated radiotherapy for patients with locally advanced esophageal squamous cell carcinoma[J]. Ann Transl Med, 2020, 8(18): 1160. doi: 10.21037/atm-20-4366
[18] Tan L, Cheng D, Wen J, et al. Identification of prognostic hypoxia-related genes signature on the tumor microenvironment in esophageal cancer[J]. Math Biosci Eng, 2021, 18(6): 7743-7758. doi: 10.3934/mbe.2021384
[19] Zhou X, You M, Wang F, et al. Multifunctional Graphdiyne-Cerium Oxide Nanozymes Facilitate MicroRNA Delivery and Attenuate Tumor Hypoxia for Highly Efficient Radiotherapy of Esophageal Cancer[J]. Adv Mater, 2021, 33(24): e2100556. doi: 10.1002/adma.202100556
[20] Hulshof MCCM, Geijsen ED, Rozema T, et al. Randomized study on dose escalation in definitive chemoradiation for patients with locally advanced esophageal cancer (ARTDECO Study)[J]. J Clin Oncol, 2021, 39(25): 2816-2824. doi: 10.1200/JCO.20.03697
[21] Lin FC, Chang WL, Chiang NJ, et al. Radiation dose escalation can improve local disease control and survival among esophageal cancer patients with large primary tumor volume receiving definitive chemoradiotherapy[J]. PLoS One, 2020, 15(8): e0237114. doi: 10.1371/journal.pone.0237114
[22] Favareto SL, Sousa CF, Pinto PJ, et al. Clinical Prognostic Factors for Patients With Esophageal Cancer Treated With Definitive Chemoradiotherapy[J]. Cureus, 2021, 13(10): e18894.
[23] Matsumoto S, Wakatsuki K, Nakade H, et al. Impact of CT-assessed changes in tumor size after neoadjuvant chemotherapy on pathological response and survival of patients with esophageal squamous cell carcinoma[J]. Langenbecks Arch Surg, 2022, 407(3): 965-974. doi: 10.1007/s00423-022-02430-x
[24] Wongwaiyut K, Ruangsin S, Laohawiriyakamol S, et al. Pretreatment Esophageal Wall Thickness Associated with Response to Chemoradiotherapy in Locally Advanced Esophageal Cancer[J]. J Gastrointest Cancer, 2020, 51(3): 947-951. doi: 10.1007/s12029-019-00337-3
[25] Li TT, Fu XB, Xiao LH, et al. The long-term impact of tumor burden in pT3N0M0 esophageal squamous cell carcinoma: A propensity score-matched analysis[J]. Medicine (Baltimore), 2019, 98(42): e17637. doi: 10.1097/MD.0000000000017637
[26] Yue YT, Li N, Shahid H, et al. Gross Tumor Volume Definition and Comparative Assessment for Esophageal Squamous Cell Carcinoma From 3D 18 F-FDG PET/CT by Deep Learning-Based Method[J]. Front Oncol, 2022, 12: 799207. doi: 10.3389/fonc.2022.799207
[27] Chen Y, Huang Q, Chen J, et al. Primary gross tumor volume is prognostic and suggests treatment in upper esophageal cancer[J]. BMC Cancer, 2021, 21(1): 1130. doi: 10.1186/s12885-021-08838-w
[28] Huang RH, Guo H, Chen JZ, et al. Intratreatment Tumor Volume Change During Definitive Chemoradiotherapy is Predictive for Treatment Outcome of Patients with Esophageal Carcinoma[J]. Cancer Manag Res, 2020, 12: 7331-7339. doi: 10.2147/CMAR.S246500
[29] Li SH, Rau KM, Lu HI, et al. Pre-treatment maximal oesophageal wall thickness is independently associated with response to chemoradiotherapy in patients with T3-4 oesophageal squamous cell carcinoma[J]. Eur J Cardiothorac Surg, 2012, 42(6): 958-964. doi: 10.1093/ejcts/ezs136
[30] Wu Y, Li J. Change in Maximal Esophageal Wall Thickness Provides Prediction of Survival and Recurrence in Patients with Esophageal Squamous Cell Carcinoma After Neoadjuvant Chemoradiotherapy and Surgery[J]. Cancer Manag Res, 2021, 13: 2433-2445. doi: 10.2147/CMAR.S295646
[31] Chen CZ, Chen JZ, Luo T, et al. Late Toxicities, Failure Patterns, Local Tumor Control, and Survival of Esophageal Squamous Cell Carcinoma Patients After Chemoradiotherapy With a Simultaneous Integrated Boost: A 5-Year Phase Ⅱ Study[J]. Front Oncol, 2021, 11: 738936. doi: 10.3389/fonc.2021.738936
[32] Chen Y, Zhu HP, Wang T, et al. What is the optimal radiation dose for non-operable esophageal cancer? Dissecting the evidence in a meta-analysis[J]. Oncotarget, 2017, 8(51): 89095-89107. doi: 10.18632/oncotarget.18760
[33] Xu Y, Dong B, Zhu W, et al. A phase III multicenter randomized clinical trial of 60 Gy vs. 50 Gy radiation dose in concurrent chemoradiotherapy for inoperable esophageal squamous cell carcinoma[J]. Clin Cancer Res, 2022, 28(9): 1792-1799. doi: 10.1158/1078-0432.CCR-21-3843
[34] Fokas E, Martin D, Rödel C. Radiotherapy dose escalation does not improve local control in patients with esophageal cancer after definitive radiochemotherapy: the ARTDECO randomized phase Ⅲ trial[J]. Strahlenther Onkol, 2022, 198(4): 397-399. doi: 10.1007/s00066-022-01906-5
[35] Luo HS, Huang HC, Lin LX, et al. Effect of modern high-dose versus standard-dose radiation in definitive concurrent chemo-radiotherapy on outcome of esophageal squamous cell cancer: a meta-analysis[J]. Radiat Oncol, 2019, 14(1): 178. doi: 10.1186/s13014-019-1386-x
计量
- 文章访问数: 882
- HTML全文浏览量: 3169
- PDF下载量: 111

