
Construction of Prognostic Prediction Model for Lung Squamous Cell Carcinoma Based on Cuproptosis-related LncRNAs
-
摘要:目的
基于铜死亡相关lncRNAs(CRLs)开发一种新的风险评分模型预测肺鳞癌(LUSC)患者预后情况。
方法研究数据主要来自TCGA、GTEx数据库。通过单因素Cox、Lasso和多因素Cox回归分析确定影响LUSC预后独立的CRLs并建立风险评分模型。通过计算ROC曲线下面积(AUC)比较风险评分特征与临床特征单独预测LUSC生存率的能力。高、低风险组之间进行免疫相关功能、免疫检查点差异分析。
结果筛选了9个CRLs是LUSC患者预后独立的lncRNA并开发风险评分模型,并且风险评分是LUSC预后影响因素。风险评分模型预测LUSC患者1、3、5年生存率的AUC值分别为0.710、0.718、0.743。高、低风险组在部分免疫相关功能和免疫检查点之间存在统计学差异(P < 0.05)。
结论基于9个CRLs开发的风险评分模型有助于临床预测LUSC患者预后、免疫治疗反应。
Abstract:ObjectiveTo develop a new risk scoring model based on cuproptosis-related lncRNAs (CRLs) to predict the prognosis of lung squamous cell carcinoma (LUSC).
MethodsData were obtained mainly from TCGA and GTEx databases. Univariate Cox, Lasso, and multivariate Cox regression analyses were conducted to determine CRLs that affect the prognosis of LUSC and establish a risk scoring model. The ability of risk score characteristics to independently predict LUSC survival was compared with that of clinical characteristics by calculating the area under the ROC curve (AUC). Immune-related functions and immune checkpoint differences were compared between high- and low-risk groups.
ResultsNine CRLs were selected as independent prognostic lncRNAs for LUSC, and a risk scoring model was developed. Risk score was the influence factor for the prognosis of LUSC. The AUC values predicted by the risk score model for 1-, 3-, and 5-year survival rates of patients with LUSC were 0.710, 0.718, and 0.743, respectively. The high- and low-risk groups were partly statistically different in terms of immune-related functional assays and immune checkpoint assays (P < 0.05).
ConclusionThe risk scoring model developed based on nine CRLs could predict the prognosis and immune therapy response of patients with LUSC in clinical practice.
-
Key words:
- Lung squamous cell carcinoma /
- Cuproptosis /
- LncRNA /
- Immune therapy
-
0 引言
肺癌发病率和死亡率居高不下,其中肺鳞癌(lung squamous cell carcinoma, LUSC)是肺癌中的常见病理亚型[1]。LUSC患者早期临床症状不明显,大多数患者临床确诊时,已处于中晚期,患者预后、治疗效果不太理想,导致LUSC患者5年生存率很低[2]。
研究发现长链非编码RNA(long noncoding RNA, lncRNA)影响肺鳞癌细胞增殖、迁移和凋亡[3]。Tsvetkov新发现了一种新的细胞死亡形式—铜死亡[4]。铜死亡相关lncRNAs(cuproptosis related lncRNAs, CRLs)的研究成为新热点,越来越多的研究表明CRLs与癌症患者的预后密切相关[5-6]。然而,CRLs与LUSC的进展是否有关尚不清楚,是否可以作为预测LUSC患者预后、选择免疫治疗和药物治疗的重要指标也尚不清楚。因此,本研究基于CRLs开发了一种新的LUSC患者预后模型,并进一步开展免疫相关功能分析、免疫检查点基因(immune checkpoint genes, ICGs)分析,为LUSC的预后和患者个体免疫化治疗选择提供科学依据。
1 资料与方法
1.1 数据收集及预处理
从GTEx数据库(https://www.gtexportal.org/)下载正常肺组织的RNA-sep表达矩阵,共获取288例。从TCGA数据库(https://portal.gdc.cancer.gov/)下载LUSC的RNA-sep表达矩阵,其中LUSC组织502例、对照组49例,并对数据进行批量归一化。同时下载了TCGA-LUSC患者临床数据,排除临床资料缺失、生存期 < 30天、RNA-seq表达矩阵不完整的患者,最终共纳入451例LUSC患者。通过查阅文献,检索到19个铜死亡基因[7],49个免疫检查点基因[8]。
1.2 差异表达CRLs的鉴定
利用“limma”R包对铜死亡基因与TCGA-LUSC组织中lncRNAs进行共表达分析,以|R| > 0.3且P < 0.001为筛选标准,鉴定出CRLs[9]。结合GTEx,鉴定差异表达的CRLs,设置筛选条件为|logFC| > 1且Adjusted P < 0.05,并利用“pheatmap”R包绘制火山图进行展示[10]。
1.3 基于CRLs的LUSC预后风险模型的建立与评估
将以上差异表达的CRLs表达量与生存状态、生存时间合并。通过单因素Cox回归分析、Lasso回归分析以及多因素Cox回归分析,筛选与LUSC预后相关的CRLs以及计算它们的回归系数,建立LUSC预后风险评分模型:Risk score=(lncRNA1表达量*系数)+(lncRNA2表达量*系数)+...+(lncRNAn表达量*系数)。
根据风险评分的中位值,将LUSC患者重新划分为高风险组和低风险组,并应用“survminer”R包对高、低风险组的总生存期(OS)进行生存分析。绘制C-index曲线以及ROC曲线下面积(AUC)评估风险评分模型预测LUSC患者预后能力。
1.4 列线图预后模型的建立及评估
将临床特征及风险评分一起进行单因素及多因素Cox回归分析,以确定独立的预后特征。使用“rms”R包建立列线图模型。通过计算AUC值以及绘制校准曲线、决策曲线分析(decision curve analysis, DCA)评估列线图模型的预测效能。
1.5 风险评分在预测患者免疫治疗中的作用
本研究利用单样本基因集富集分析(single sample gene set enrichment analysis, ssGSEA)对TCGA-LUSC中每个样本进行免疫相关功能评分[11]。探究免疫相关功能、ICGs在高、低风险组之间的差异情况[12]。
1.6 统计学方法
本研究应用R软件(https://mirrors.tuna.tsinghua.edu.cn/CRAN/,版本4.1.1)和Perl软件(https://www.perl.org,版本5.30)进行数据整理及分析。P < 0.05为差异有统计学意义。
2 结果
2.1 筛选差异表达的CRLs
从TCGA-LUSC资料库中提取了19个铜死亡基因以及16 882个lncRNAs的表达量。进行共表达分析以鉴定CRLs。根据设置Pearson的相关标准(|R| > 0.3且P < 0.001)识别出1 445个CRLs。
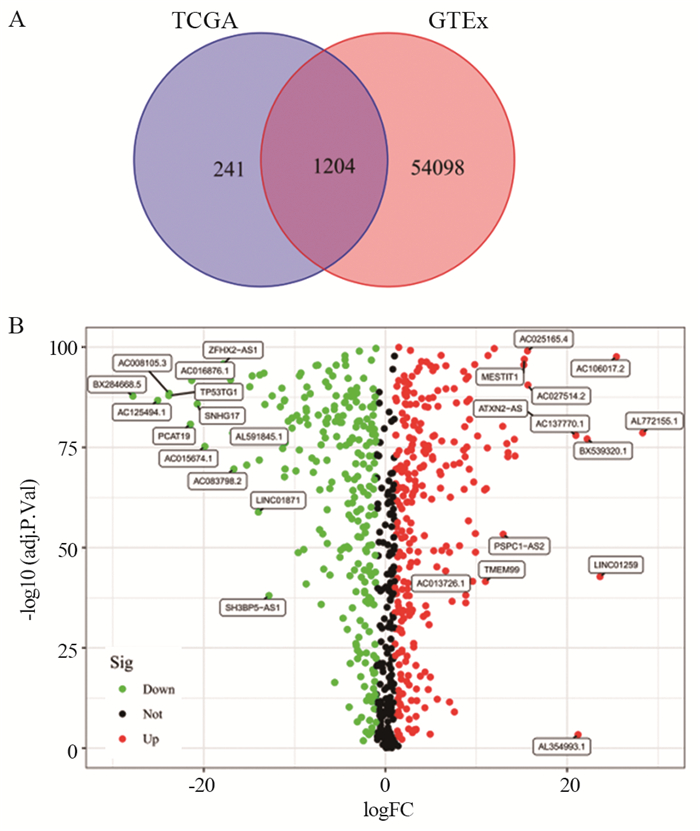
利用韦恩图的方式将TCGA数据库中1 455个CRLs与GTEx数据库中相关基因取交集,共获得1 204个CRLs,见图 1A,根据|logFC|>1且P < 0.05,发现LUSC与对照组之间有721个CRLs的表达量存在显著差异,其中382个CRLs上调,339个CRLs下调,结果以火山图形式进行展现,见图 1B。
![]() 图 1 筛选LUSC中差异表达的CRLsFigure 1 Screening for differentially expressed CRLs in LUSCLUSC: lung squamous cell carcinoma; A: Wayne plot (intersection of cuproptosis-related lncRNAs in TCGA-LUSC and related genes in GTEx); B: volcano map (differential expression of lncRNAs between LUSC tissue and control group).
图 1 筛选LUSC中差异表达的CRLsFigure 1 Screening for differentially expressed CRLs in LUSCLUSC: lung squamous cell carcinoma; A: Wayne plot (intersection of cuproptosis-related lncRNAs in TCGA-LUSC and related genes in GTEx); B: volcano map (differential expression of lncRNAs between LUSC tissue and control group).2.2 CRLs预后模型的构建
将以上筛选的721个CRLs,通过单因素Cox回归分析从中获得42个CRLs与LUSC患者的OS显著相关,见图 2A。Lasso回归分析对变量进行降维,筛选出27个最具代表性的CRLs,见图 2B、C。对27个CRLs进行多因素Cox回归分析,结果显示有9个CRLs是LUSC预后独立的lncRNA。其中BX546450.2、AP006545.1的风险比(HR) < 1;AP003071.4、AC092140.2、BLACE、AC007336.1、AC012676.4、LINC00229、AC060814.2的HR > 1,见图 2D。此外,我们利用桑基图展现铜死亡基因与这9个CRLs之间共表达关系,见图 2E。Risk score= [AP003071.4表达量*(0.582)]+[AC092140.2表达量*(0.474)]-[BX546450.2表达量*(0.246)]+[BLACE表达量*(0.115)]+[AC007336.1表达量*(0.833)]+[AC012676.4表达量*(0.896)]+[LINC00229表达量*(0.122)]-[AP006545.1表达量*(0.288)]+[AC060814.2表达量*(0.384)]。
![]() 图 2 基于CRLs的LUSC患者风险模型Figure 2 Risk model based on CRLs for patients with LUSCA: forest plot identifying 42 CRLs significantly associated with clinical outcomes by univariate Cox regression analysis; B: coefficient distribution of 27 OS-related CRLs selected by lasso regression; C: cross validation of optimal parameter λ for the selection process; D: forest plots showing nine independent prognostic CRLs through multivariate Cox regression analysis; E: Sangi diagram showing the co-expression relationship among cuproptosis genes, CRLs, and risk types.
图 2 基于CRLs的LUSC患者风险模型Figure 2 Risk model based on CRLs for patients with LUSCA: forest plot identifying 42 CRLs significantly associated with clinical outcomes by univariate Cox regression analysis; B: coefficient distribution of 27 OS-related CRLs selected by lasso regression; C: cross validation of optimal parameter λ for the selection process; D: forest plots showing nine independent prognostic CRLs through multivariate Cox regression analysis; E: Sangi diagram showing the co-expression relationship among cuproptosis genes, CRLs, and risk types.2.3 风险评分模型的预后价值
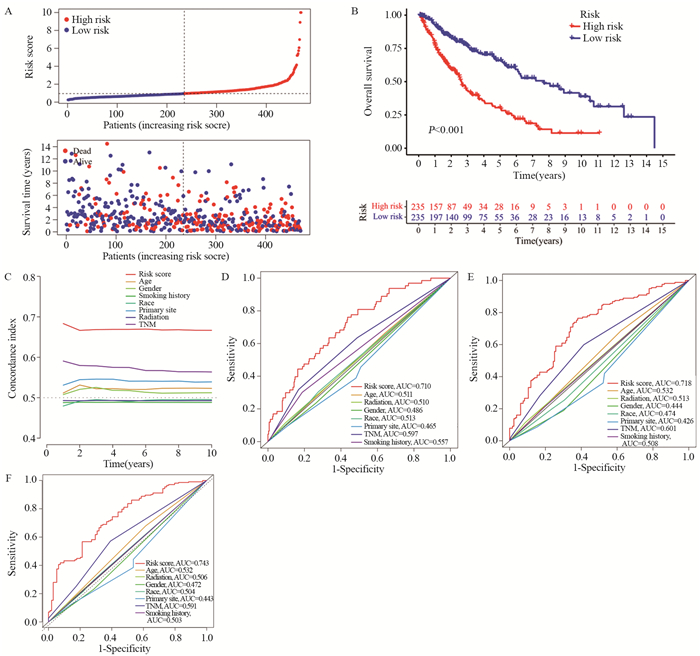
使用风险评分公式计算了451例LUSC患者的风险评分,取中位值,将所有LUSC患者划分为高风险组与低风险组。风险评分分布的风险曲线、散点图显示患者随着风险评分增加,患者死亡率升高,见图 3A。Kaplan-Meier生存曲线比较两组之间的OS,发现LUSC患者高风险组患者的OS低于低风险组(P < 0.001),见图 3B。绘制C-index曲线,发现风险评分的C-index依次高于年龄、性别、吸烟史、种族、原发肿瘤位置、放疗史、TNM分期,见图 3C。计算风险评分及临床特征预测LUSC患者1、3、5年生存率的AUC值,结果显示风险评分预测LUSC患者1、3、5年生存率的AUC值分别为0.710、0.718、0.743,均大于其他临床特征,见图 3D~F。
![]() 图 3 风险评分模型的预后价值Figure 3 Prognostic value of the risk score modelA: patients with LUSC were ranked according to risk score, and correlation between survival status and risk score was indicated using scatter plots; B: Kaplan–Meier survival curves for OS of patients with LUSC in high-and low-risk groups; C: C-index curve for assessment of risk score characteristics and clinical features independently to determine the OS probability of the patients at each time point; D-F: AUC values of ROC curves comparing the accuracy of risk scores and other clinical features in predicting the 1-, 3-, and 5-year survival rates of the patients.
图 3 风险评分模型的预后价值Figure 3 Prognostic value of the risk score modelA: patients with LUSC were ranked according to risk score, and correlation between survival status and risk score was indicated using scatter plots; B: Kaplan–Meier survival curves for OS of patients with LUSC in high-and low-risk groups; C: C-index curve for assessment of risk score characteristics and clinical features independently to determine the OS probability of the patients at each time point; D-F: AUC values of ROC curves comparing the accuracy of risk scores and other clinical features in predicting the 1-, 3-, and 5-year survival rates of the patients.2.4 确定独立预后特征
为了确定独立预后特征,将年龄、性别、种族、肿瘤原发位置、TNM分期、吸烟史、放疗史以及风险评分一起进行单因素及多因素Cox回归分析,结果显示年龄:≥65岁(HR=1.48, 95%CI: 1.07~2.05, P=0.018)、性别:女(HR=0.61, 95%CI: 0.43~0.87, P=0.006、肿瘤原发部位:肺中叶(HR=3.32, 95%CI: 1.69~6.52, P < 0.001)和肺下叶(HR=0.72, 95%CI: 0.52~1.00, P=0.048)、TNM分期:Ⅲ期(HR=1.95, 95%CI: 1.33~2.85, P < 0.001)以及风险评分特征:高风险(HR=3.04, 95%CI: 2.22~4.15, P < 0.001)是LUSC患者预后影响因素,见图 4。
![]() 图 4 LUSC预后的多因素Cox回归分析结果森林图Figure 4 Forest map of multivariate Cox regression analysis of LUSC prognosis
图 4 LUSC预后的多因素Cox回归分析结果森林图Figure 4 Forest map of multivariate Cox regression analysis of LUSC prognosis2.5 构建及评估列线图预测模型
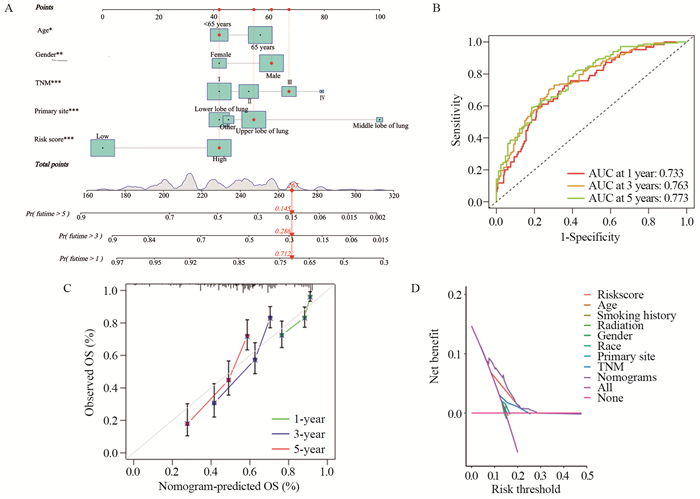
基于性别、年龄、肿瘤原发部位、TNM分期和风险评分构建LUSC患者预测预后列线图模型,见图 5A。列线图模型预测LUSC患者1、3、5年生存率的AUC值分别为0.733、0.763、0.773。与风险评分模型相比,列线图模型进一步增强了预测能力,见图 5B。校准曲线显示患者实际1、3、5年生存率与预测患者1、3、5年生存率一致性较高,见图 5C,表明模型校准度强。DCA显示列线图模型的临床预测效能较好,见图 5D。
![]() 图 5 构建及评估预测LUSC患者预后的列线图模型Figure 5 Construction and evaluation of the nomogram model to predict the prognosis of patients with LUSCA: nomogram developed to predict prognosis based on age, gender, stage, primary tumor location, and risk score. *: P < 0.05, **: P < 0.01, ***: P < 0.001; B: AUC values of the nomograms for predicting the 1-, 3-, and 5-year survival rates of patients with LUSC; C: calibration curves of the nomograms; D: DCA for assessment of the clinical efficacy of the model.
图 5 构建及评估预测LUSC患者预后的列线图模型Figure 5 Construction and evaluation of the nomogram model to predict the prognosis of patients with LUSCA: nomogram developed to predict prognosis based on age, gender, stage, primary tumor location, and risk score. *: P < 0.05, **: P < 0.01, ***: P < 0.001; B: AUC values of the nomograms for predicting the 1-, 3-, and 5-year survival rates of patients with LUSC; C: calibration curves of the nomograms; D: DCA for assessment of the clinical efficacy of the model.2.6 风险评分与免疫特征的相关性分析
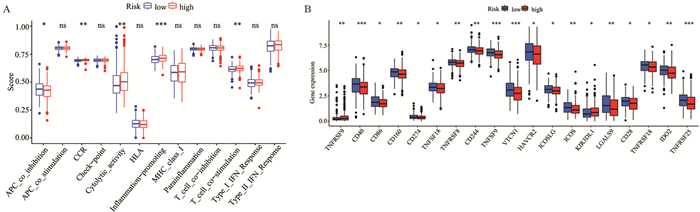
为了进一步探索LUSC不同风险人群与抗肿瘤免疫之间的关系,本研究使用ssGSEA分析了免疫相关功能与LUSC高风险、低风险人群之间的相关性。结果显示抑制肿瘤抑制基因、细胞因子受体、细胞溶解活性、炎性反应以及T细胞共同刺激等免疫功能存在显著差异,见图 6A。细胞因子受体、细胞溶解活性、炎性反应以及T细胞共同刺激在高风险组中更活跃。本研究还比较了高风险和低风险组中免疫检查点基因的表达水平,结果显示49个ICGs中有19个ICGs在高低危险组中存在差异,其中17个ICGs(CD40、CD86、CD160、CD274、TNFSF18、TNFRSF8、CD244、TNFSF9、VTCN1、HAVCR2、ICOSLG、ICOS、LGALS9、CD28、TNFRSF18、IDO2、TNFRSF25)在低风险组中的表达高于高风险组,有2个ICGs(TNFRSF9、KIR3DL1)在高风险组的表达高于低风险组(P < 0.05),见图 6B。
![]() 图 6 风险评分与免疫特征的相关性分析Figure 6 Correlation analysis of risk score and immune signaturens: not statistically significant; *: P < 0.05; **: P < 0.01; ***: P < 0.001; A: comparison of immune-related functions between the high-and low-risk groups; B: comparison of the expression of immune checkpoint genes between the two groups.
图 6 风险评分与免疫特征的相关性分析Figure 6 Correlation analysis of risk score and immune signaturens: not statistically significant; *: P < 0.05; **: P < 0.01; ***: P < 0.001; A: comparison of immune-related functions between the high-and low-risk groups; B: comparison of the expression of immune checkpoint genes between the two groups.3 讨论
LINC00482主要被报道于其他部位的肿瘤,如膀胱细胞癌和肝细胞癌[13-14]。LINC00482在膀胱癌细胞和组织中高表达,LINC00482可作为致癌基因结合转录因子FOXA1发挥作用,LINC00482通过FOXA1在膀胱细胞癌中下调MMP-15的表达量,抑制膀胱肿瘤相关炎性反应和血管生成。本研究也发现LINC00482是LUSC的危险因素,对LUSC预后不利。本研究对lncRNAs在肿瘤进展过程中的作用知之甚少。提示研究这些未知的lncRNAs,可以确定预测LUSC预后和治疗的新方案。
以往研究基于29个铁死亡相关lncRNAs开发的风险评分模型预测LUSC患者1、3年生存率的AUC值分别是0.658、0.693[15]。而本研究基于9个CRLs开发的风险评分模型相对较优,预测LUSC患者1、3、5年生存率的AUC值分别是0.710、0.718和0.743。此外,风险评分能够准确区分LUSC患者的高低风险组,并且高风险患者的OS低于低风险患者。
本研究中,多因素Cox回归分析发现年龄、性别、肿瘤原发部位、TNM分期与LUSC患者预后密切相关。患者年龄越大对预后越不利,与Liu等[16]研究结果一致。以往研究表明,与男性相比,女性患者癌细胞发生转移频率更低[17]。因此,男性患者的生存结果比女性差,与本研究结果一致。国外学者研究报道,由于肺中叶解剖结构独特,它被肺上叶、肺下叶以及心包包围,不易于发现且临床症状轻,大多数患者确诊时已发生转移,与肺上叶患者相比,其预后差[18]。此外,风险评分是LUSC预后的影响因素,且风险评分特征的C-index和AUC值均大于其他临床特征。综上所述,本研究基于9个CRLs开发的风险评分模型可以更准确的预测LUSC的预后情况。
癌细胞的进展与免疫抑制有关,癌细胞通过不同的机制逃避免疫系统监视,包括激活抑制抗肿瘤免疫反应的免疫功能和免疫检查点通路。ICGs在调节自身免疫反应性方面发挥着核心作用,成为肿瘤治疗重要手段[19]。免疫功能分析显示,高风险组患者更多参与细胞因子受体、细胞溶解活性、炎性反应以及T细胞共同刺激等免疫功能。表明这些免疫功能在低风险组中受到抑制,需要激活它们,增强机体的抗肿瘤免疫功能,从而抵抗癌细胞的攻击,延长低风险组患者的生存时间[10]。ICGs差异分析,发现只有TNFRSF9在高风险组中表达水平高于低风险组。TNFRSF9是一种T细胞共刺激受体,它对调节性T细胞、活化的自然杀伤T细胞和活化的NK细胞有作用,提示TNFRSF9抑制剂进入机体后,机体的T细胞可以识别癌细胞,通过免疫系统杀死癌细胞,改善高风险患者预后[20-21]。总之,风险评分模型可以在一定程度上反映免疫治疗的效果和免疫应答率,从不同的角度为LUSC患者的免疫干预治疗提供新的见解。
本研究存在几处局限性。首先,研究数据是从国外公共据库(TCGA和GTEx)提取,缺乏临床样本对结果进行外部验证。其次,在以往研究中发现手术、化疗对LUSC患者预后也有显著影响,但国外数据库的临床信息中缺乏这些治疗方法。因此,有必要收集更多的LUSC临床样本,以及更全面的临床特征进行外部验证。
综上所述,本研究构建了一个基于9种CRLs的风险模型,在预测LUSC患者预后方面准确性高。同时,风险评分结合年龄、性别、TNM分期以及肿瘤原发位置构建的列线图模型,可以作为一种新颖的临床工具使用。本研究增加了免疫相关功能分析、ICGs分析,对LUSC的预后和患者个体免疫化治疗选择提供科学依据。
Competing interests: The authors declare that they have no competing interests.利益冲突声明:所有作者均声明不存在利益冲突。作者贡献:安梦霞:数据分析与论文撰写王萍玉:提供研究思路及修改论文 -
![]()
图 4 LUSC预后的多因素Cox回归分析结果森林图
Figure 4 Forest map of multivariate Cox regression analysis of LUSC prognosis
![]()
图 5 构建及评估预测LUSC患者预后的列线图模型
Figure 5 Construction and evaluation of the nomogram model to predict the prognosis of patients with LUSC
-
[1] Sung H, Ferlay J, Siegel RL, et al. Global Cancer Statistics 2020: GLOBOCAN Estimates of Incidence and Mortality Worldwide for 36 Cancers in 185 Countries[J]. CA Cancer J Clin, 2021, 71(3): 209-249. doi: 10.3322/caac.21660
[2] Bezzecchi E, Ronzio M, Dolfini D, et al. NF-YA Overexpression in Lung Cancer: LUSC[J]. Genes (Basel), 2019, 10(11): 937. doi: 10.3390/genes10110937
[3] 郑建洲, 白煜, 戚春建. LncRNA FENDRR通过调控ERK/MAPK影响肺鳞癌H226细胞增殖、迁移和凋亡[J]. 肿瘤防治研究, 2022, 49(6): 563-568. doi: 10.3971/j.issn.1000-8578.2022.21.1193 Zheng JZ, Bai Y, Qi CJ. LncRNA FENDRR affect proliferation, migration and apoptosis of lung squamous cell carcinoma H226 cells via ERK/MAPK signaling pathway[J]. Zhong Liu Fang Zhi Yan Jiu, 2022, 49(6): 563-568. doi: 10.3971/j.issn.1000-8578.2022.21.1193
[4] Tsvetkov P, Coy S, Petrova B, et al. Copper induces cell death by targeting lipoylated TCA cycle proteins[J]. Science, 2022, 375(6586): 1254-1261. doi: 10.1126/science.abf0529
[5] Chen Y, Tang L, Huang W, et al. Identification and validation of a novel cuproptosis-related signature as a prognostic model for lung adenocarcinoma[J]. Front Endocrinol(Lausanne), 2022, 13: 963220. doi: 10.3389/fendo.2022.963220
[6] Shen Y, Li D, Liang Q, et al. Cross-talk between cuproptosis and ferroptosis regulators defines the tumor microenvironment for the prediction of prognosis and therapies in lung adenocarcinoma[J]. Front Immunol, 2023, 13: 1029092. doi: 10.3389/fimmu.2022.1029092
[7] Bai Y, Zhang Q, Liu F, et al. A novel cuproptosis-related lncRNA signature predicts the prognosis and immune landscape in bladder cancer[J]. Front Immunol, 2022, 13: 1027449. doi: 10.3389/fimmu.2022.1027449
[8] Wang H, Liu J, Yang J, et al. A novel tumor mutational burden-based risk model predicts prognosis and correlates with immune infiltration in ovarian cancer[J]. Front Immunol, 2022, 13: 943389. doi: 10.3389/fimmu.2022.943389
[9] Tang R, Wu Z, Rong Z, et al. Ferroptosis-related lncRNA pairs to predict the clinical outcome and molecular characteristics of pancreatic ductal adenocarcinoma[J]. Brief Bioinform, 2022, 23(1): bbab388. doi: 10.1093/bib/bbab388
[10] Zhao C, Zhang Z, Jing T. A novel signature of combing cuproptosis-with ferroptosis-related genes for prediction of prognosis, immunologic therapy responses and drug sensitivity in hepatocellular carcinoma[J]. Front Oncol, 2022, 12: 1000993. doi: 10.3389/fonc.2022.1000993
[11] Zhou Y, Shu Q, Fu Z, et al. A novel risk model based on cuproptosis-related lncRNAs predicted prognosis and indicated immune microenvironment landscape of patients with cutaneous melanoma[J]. Front Genet, 2022, 13: 959456. doi: 10.3389/fgene.2022.959456
[12] Wu Z, Huang X, Cai M, et al. Potential biomarkers for predicting the overall survival outcome of kidney renal papillary cell carcinoma: an analysis of ferroptosis-related LNCRNAs[J]. BMC Urol, 2022, 22(1): 152. doi: 10.1186/s12894-022-01037-0
[13] Wang Y, Zhang L, Wei N, et al. Silencing LINC00482 inhibits tumor-associated inflammation and angiogenesis through down-regulation of MMP-15 via FOXA1 in bladder cancer[J]. Aging (Albany NY), 2020, 13(2): 2264-2278.
[14] Liu Z, Pu Y, Bao Y, et al. Investigation of Potential Molecular Biomarkers for Diagnosis and Prognosis of AFP-Negative HCC[J]. Int J Gen Med, 2021, 14: 4369-4380. doi: 10.2147/IJGM.S323868
[15] Yao N, Zuo L, Yan X, et al. Systematic analysis of ferroptosis-related long non-coding RNA predicting prognosis in patients with lung squamous cell carcinoma[J]. Transl Lung Cancer Res, 2022, 11(4): 632-646. doi: 10.21037/tlcr-22-224
[16] Liu Y, Sun M, Xiong Y, et al. Construction and Validation of Prognosis Nomogram for Metastatic Lung Squamous Cell Carcinoma: A Population-Based Study[J]. Technol Cancer Res Treat, 2022, 21: 15330338221132035.
[17] Lee SY, Walter V, Zhu J, et al. Impact of HFE variants and sex in lung cancer[J]. PLoS One, 2019, 14(12): e0226821. doi: 10.1371/journal.pone.0226821
[18] Lee HW, Lee CH, Park YS. Location of stageⅠ-Ⅲ non-small cell lung cancer and survival rate: Systematic review and meta-analysis[J]. Thorac Cancer, 2018, 9(12): 1614-1622. doi: 10.1111/1759-7714.12869
[19] Wang C, Tang Y, Ma H, et al. Identification of Hypoxia-Related Subtypes, Establishment of Prognostic Models, and Characteristics of Tumor Microenvironment Infiltration in Colon Cancer[J]. Front Genet, 2022, 13: 919389. doi: 10.3389/fgene.2022.919389
[20] Wang C, Lin GH, McPherson AJ, et al. Immune regulation by 4-1BB and 4-1BBL: complexities and challenges[J]. Immunol Rev, 2009, 229(1): 192-215. doi: 10.1111/j.1600-065X.2009.00765.x
[21] Cristescu R, Mogg R, Ayers M, et al. Pan-tumor genomic biomarkers for PD-1 checkpoint blockade-based immunotherapy[J]. Science, 2018, 362(6411): eaar3593. doi: 10.1126/science.aar3593
 下载:
下载:


计量
- 文章访问数: 1941
- HTML全文浏览量: 626
- PDF下载量: 481

